 Tweet
Tweet
Before proposing to implement PAX based overall results, we need to evaluate how accurate those factors are and know how much changing track conditions can have an effect.
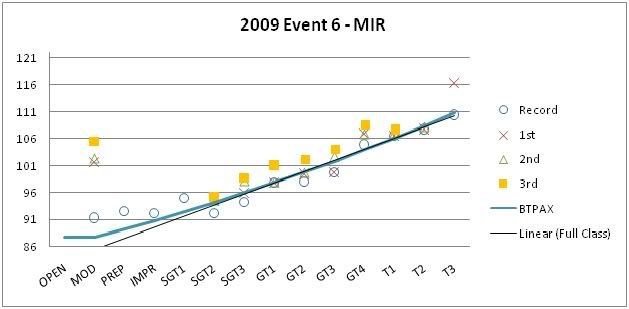
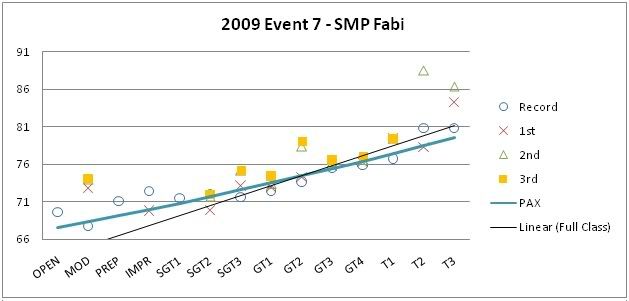
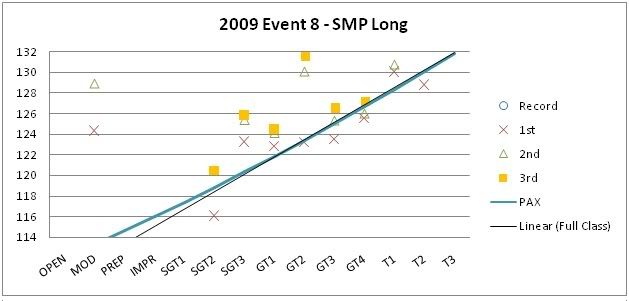
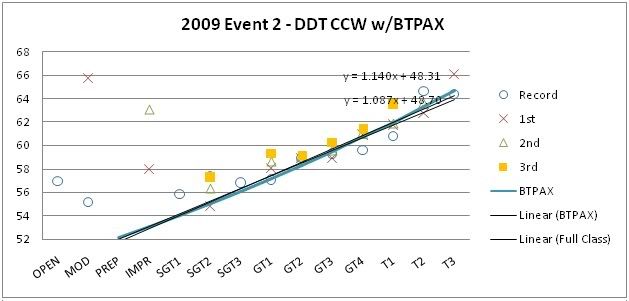
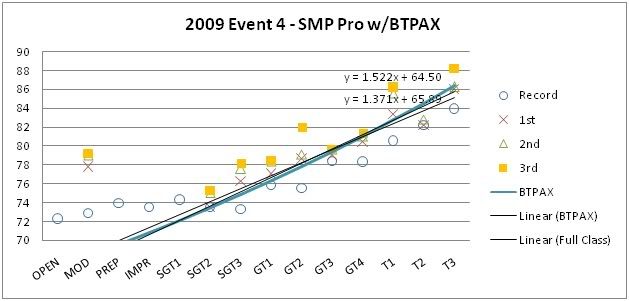
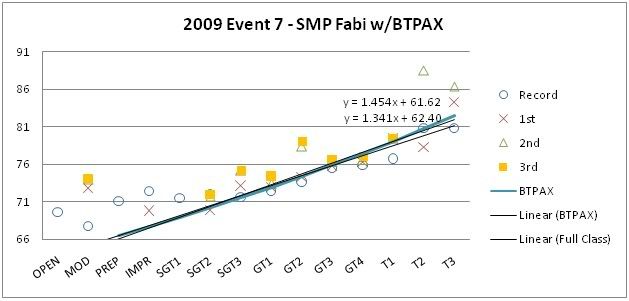
Below are the PAX figures for each event this year. I included a trend line that represents the actual times of the filled class winners of each day (by definition in the rules, these are the times that determine the PAX average). The idea is that the closer it matches the slope of the PAX line, the more accurate our PAX numbers are for a given track. Also, the more closely matched car classifications are for the PAX factors.
The first 8 figures show the normal PAX factors we use for all but MIR (where James' proposed BTPAX was used). There is poorer correlation for DDT (2), Pro (4), and Fabi (7) but they happen to be all similar, with higher classes having the advantage. This suggests BTPAX may be more suitable. Applying the BTPAX to those tracks in figures 9, 10, and 11 show how much better they correlate.
With the exception of MIR (5), the error between the actual class performances relative to the PAX factors is around 0.2%time/Class or less. This is a percentage of the difference in lap time separating each class. To put that in to perspective, our linear classing spaces each class out about 1.3%time/Class. So in other words, it is saying the PAX factors are separating the classes by 5.8PIPs rather than the ideal 5 PIPs but that is the worst case in 7 out of 8 events. Another perspective is that 0.2%time on a 75s lap is 0.15s.
PAX does present a problem in Event 5, MIR. The error there was about 0.6%time/Class. Unfortunately, that was the only event I missed so I'm not sure what the conditions were exactly but I am told that it was a very hot day and only 2 sessions were run. Glancing at the timesheets you'll notice that almost 2/3rds of competitors set their fastest times on the last lap of the last session. I t may be assumed that drivers were not able to extract the most out of their cars with the limited track time. The discrepancy at this event is not a big deal in my opinion for 1 out of 8 events but just goes to show you that conditions or schedule throughout a dry event day could affect PAX overall points.
So what would be the affect of that error on overall PAX based points? Since Event 6 PAX correlated quite well, we can assume that BTPAX is accurate for MIR. With that assumption, in Event 5, the theoretical difference in PAX overall points achieved would be around -2.4 points out of 100 for a competitor in T3 and +2.4 points out of 100 for someone competing in SGT2. We would have to see what the point spread is like after an entire season using PAX to know how significant an impact this would be. For example, if the totals for the top 3 overall are separated by 10 points, then an event or two where we have this large an error wouldn't make a difference in the standings. Since we only count 6 out of 8, it's actually a non-issue unless event 5 was one of only 6 events participated in. I don't have 2009 PAX scores but in 2008, the results were as follows cumulative for best 6 to give an idea of the points spread. 3 points spread the top two and 3rd/4th place were a further 6 points behind.
2008 PAX Overall Results
Overall Name Class Total Score
1 Paul McFadden SGT3 620.820
2 Chris Paczynski GT2 617.952 ORG
3 Avi Koifman SGT3 611.428
4 Jonathan Weir GT1 611.091
5 Bryan Sperandei GT2 609.148
6 Mohamed Hussain GT4 606.524
7 Mark Bothelo SGT3 605.609
8 Dave Barker GT1 605.504 ORG
9 Adam Hutchinson SGT1 604.621
Conclusions:
PAX and BTPAX values are accurate enough to score the 2009 seasons overall results on. It is quite clear using the above analysis to see which tracks are suited for PAX or BTPAX. Track changes can have an effect on overall points scored where some classes will lose and others gain but it is a small amount. The effect of changing track conditions can be mitigated by changing the order of the run groups so that the same classes are not always running at the same time of day at every event. Track condition changes during the 2009 series would not have affected overall PAX results.
Also, rain data has not been analysed. It is not a problem if it affects all classes an equal amount. But, if rain favors certain classes over others then we need to have a solution to fairly score each class before we implement PAX. The problem hasn't been defined yet so no solution is being proposed.
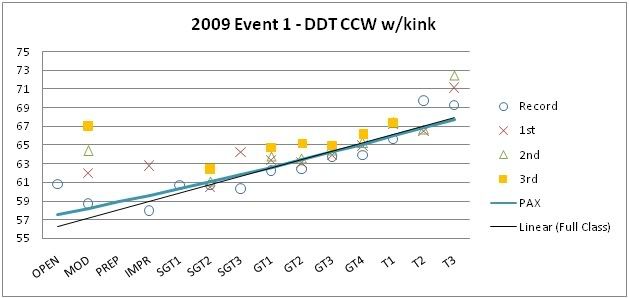
Figure 1
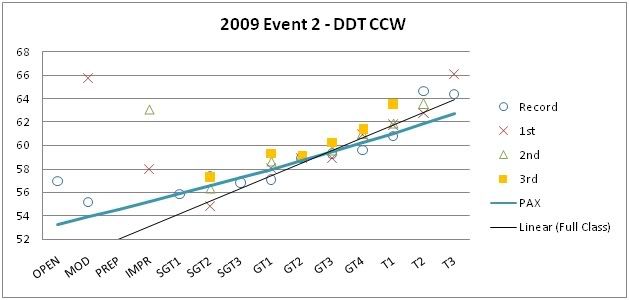
Figure 2
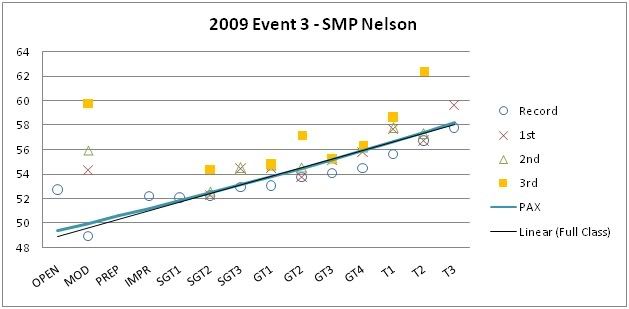
Figure 3
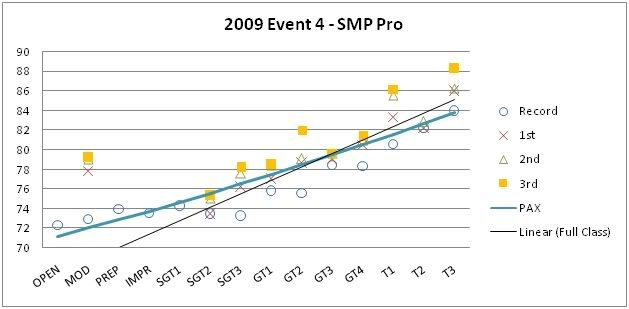
Figure 4
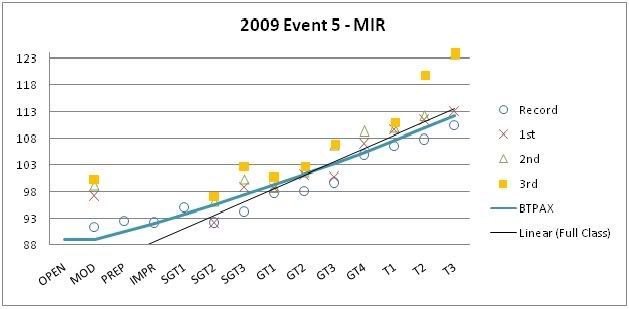
Figure 5
Below are the PAX figures for each event this year. I included a trend line that represents the actual times of the filled class winners of each day (by definition in the rules, these are the times that determine the PAX average). The idea is that the closer it matches the slope of the PAX line, the more accurate our PAX numbers are for a given track. Also, the more closely matched car classifications are for the PAX factors.
The first 8 figures show the normal PAX factors we use for all but MIR (where James' proposed BTPAX was used). There is poorer correlation for DDT (2), Pro (4), and Fabi (7) but they happen to be all similar, with higher classes having the advantage. This suggests BTPAX may be more suitable. Applying the BTPAX to those tracks in figures 9, 10, and 11 show how much better they correlate.
With the exception of MIR (5), the error between the actual class performances relative to the PAX factors is around 0.2%time/Class or less. This is a percentage of the difference in lap time separating each class. To put that in to perspective, our linear classing spaces each class out about 1.3%time/Class. So in other words, it is saying the PAX factors are separating the classes by 5.8PIPs rather than the ideal 5 PIPs but that is the worst case in 7 out of 8 events. Another perspective is that 0.2%time on a 75s lap is 0.15s.
PAX does present a problem in Event 5, MIR. The error there was about 0.6%time/Class. Unfortunately, that was the only event I missed so I'm not sure what the conditions were exactly but I am told that it was a very hot day and only 2 sessions were run. Glancing at the timesheets you'll notice that almost 2/3rds of competitors set their fastest times on the last lap of the last session. I t may be assumed that drivers were not able to extract the most out of their cars with the limited track time. The discrepancy at this event is not a big deal in my opinion for 1 out of 8 events but just goes to show you that conditions or schedule throughout a dry event day could affect PAX overall points.
So what would be the affect of that error on overall PAX based points? Since Event 6 PAX correlated quite well, we can assume that BTPAX is accurate for MIR. With that assumption, in Event 5, the theoretical difference in PAX overall points achieved would be around -2.4 points out of 100 for a competitor in T3 and +2.4 points out of 100 for someone competing in SGT2. We would have to see what the point spread is like after an entire season using PAX to know how significant an impact this would be. For example, if the totals for the top 3 overall are separated by 10 points, then an event or two where we have this large an error wouldn't make a difference in the standings. Since we only count 6 out of 8, it's actually a non-issue unless event 5 was one of only 6 events participated in. I don't have 2009 PAX scores but in 2008, the results were as follows cumulative for best 6 to give an idea of the points spread. 3 points spread the top two and 3rd/4th place were a further 6 points behind.
2008 PAX Overall Results
Overall Name Class Total Score
1 Paul McFadden SGT3 620.820
2 Chris Paczynski GT2 617.952 ORG
3 Avi Koifman SGT3 611.428
4 Jonathan Weir GT1 611.091
5 Bryan Sperandei GT2 609.148
6 Mohamed Hussain GT4 606.524
7 Mark Bothelo SGT3 605.609
8 Dave Barker GT1 605.504 ORG
9 Adam Hutchinson SGT1 604.621
Conclusions:
PAX and BTPAX values are accurate enough to score the 2009 seasons overall results on. It is quite clear using the above analysis to see which tracks are suited for PAX or BTPAX. Track changes can have an effect on overall points scored where some classes will lose and others gain but it is a small amount. The effect of changing track conditions can be mitigated by changing the order of the run groups so that the same classes are not always running at the same time of day at every event. Track condition changes during the 2009 series would not have affected overall PAX results.
Also, rain data has not been analysed. It is not a problem if it affects all classes an equal amount. But, if rain favors certain classes over others then we need to have a solution to fairly score each class before we implement PAX. The problem hasn't been defined yet so no solution is being proposed.
Figure 1
Figure 2
Figure 3
Figure 4
Figure 5

Comment